Skip to content
One week, one team

A payments team. A three‑year‑old diagram. An audit on Friday.

On Monday, the CTO asks a simple question: who understands how checkout actually works, end to end? Follow the week as Ritele connects the architecture, telemetry, and evidence to help the team find out.

Map · Monday · 14:00

Nobody can answer the CTO’s question from the old diagram. Tunde points OpenTelemetry at Ritele instead.

By the afternoon, the team can see what actually runs.

  • Ritele draws services, databases, queues, caches, gateways and external APIs from live traces, grouped by domain and sized by traffic.
  • When traffic comes from a caller it can’t identify, Ritele marks it “?” and counts it. It doesn’t guess.
Next: Tuesday, checkout slows down →
Metrics · Tuesday · 09:46

Checkout slows down, and the cause isn’t on the diagram.

The worst problem is at the top of the list.

  • Every component has a status, with the numbers behind it and the signals it was judged from.
  • Each issue shows when it started, which entry points it hurts, and the deploys around it.
Next: follow one slow request →
Traces + Logs · Tuesday · 09:49

Three minutes later, Tunde opens one of the slow checkouts.

One request, followed to the line that explains it.

  • The trace shows the request crossing each service, with the failing call highlighted.
  • Ritele reads matching lines from your own Loki on demand, masked and audited. Each trace_id links back to the trace.
Next: ask what happened →
Advisor · Tuesday · 10:05

Before writing the incident note, Tunde asks one question.

One answer, with the evidence attached.

  • The Advisor answers from metrics, traces and logs together, and names the components on the map.
  • It’s off by default. Point it at a model inside your network and nothing leaves.
Next: Wednesday, planning for ×5 →
Prediction · Wednesday · 14:00Growth plan

The fix shipped on Tuesday. Next month’s launch should bring five times the traffic.

What gives out first at ×5?

  • Describe the change, and Ritele lists what fills up, in order, at what multiple and why.
  • Each answer states how confident it is. In simulator tests across 15 system shapes, it was never late on what gives out first.
Next: Friday, the audit →
Map · Friday · 09:00Growth plan

The CTO’s question finally gets an answer.

The auditors get the architecture that actually runs.

  • Import the approved diagram as Structurizr, Mermaid or CSV, and Ritele flags new components and unexpected dependencies.
  • Export the observed map as PNG, SVG, Mermaid or Structurizr for the audit file.
Next: show how fast you are →
Speed scorecard

Show how fast you are.

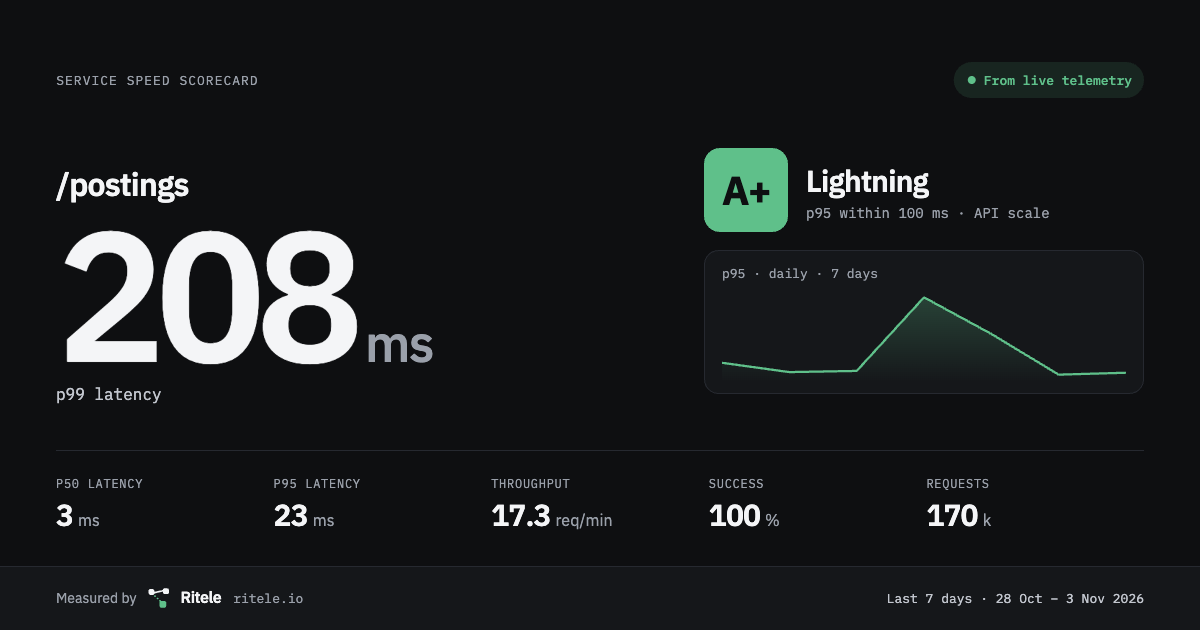
For any entry point, Ritele exports a speed scorecard: p50, p95 and p99 latency, throughput, success rate and request count over 7, 14 or 30 days, with a letter grade. It downloads as a PNG: a social card, a square, a README badge or a status-page widget, under your company name and logo.

A card is graded on its p95. A route that waits on a payment scheme is graded on the payment scale. Under 100 requests, it is not graded.

The numbers come from your own install, measured on your server. The card says “Measured by Ritele”, not “verified”, because it is an image anyone can edit. Making one sends nothing anywhere: it is drawn in your browser.

How scorecards work →
A sample speed scorecard for /postings: p99 latency 208 ms, grade A+ Lightning on the API scale, p50 3 ms, p95 23 ms, 100% success over 170k requests in 7 days.
95% of calls finish within
GradeAPI scalePayment scale
A+Lightning100 ms1 s
ASwift250 ms2 s
BSteady500 ms5 s
CFair1 s10 s
DSlow2 s30 s
FSluggishmore than 2 smore than 30 s
How scorecards work →

Start your own week.

docker run -p 4317:4317 -p 4318:4318 -p 8080:8080 -v ./data:/data ritele/ritele

One container. Point OpenTelemetry at it. Open the UI. Free up to 20 services per environment.